Installation
Metric Setup Guide
For the purposes of this guide, we will be setting up a single zone for DalmatinerDB, Tachyon, and NSQ with the below ip address and services. Note: For production setups its recommended you run multiple separated NSQ processes as well as a distributed DalmatinerDB Database.
Our setup will be as follows:
| Zone Name | IP Address | Services | Hypervisor |
|---|---|---|---|
| DalmatinerDB Zone 1 | 10.1.1.24 | Dalmatinerdb, Dalmatinerfe, NSQ, Tachyon, Grafana | 1 |
| Hypervisors Global Zone | Tachyon-Meter |
The Grafana and Dalmatinerfe part of this guide are optional. Grafana is a dashboard builder for building custom graphs using metric data stored in the database. DalmatinerFE is a very simplistic web frontend to show you the different "buckets" and metric data stored within your DalmatinerDB database.
(Step 1) Create Zone
You can create a new Zone for the metrics components using FiFo GUI or just plain SmartOS. Lets describe creating the zone 'manually' via SmartOS.
From the GZ (Global Zone) we install the base dataset which we will use. Then we have to confirm it is installed:
imgadm update
imgadm import 1bd84670-055a-11e5-aaa2-0346bb21d5a1
imgadm list | grep 1bd84670-055a-11e5-aaa2-0346bb21d5a1
If installed successfully you should see:
1bd84670-055a-11e5-aaa2-0346bb21d5a1 minimal-64-lts 14.4.2 smartos 2015-03-03T15:38:34Z
Sample contents of 1.dalmatinerdb.json
{
 "autoboot": true,
 "brand": "joyent",
 "image_uuid": "1bd84670-055a-11e5-aaa2-0346bb21d5a1",
 "delegate_dataset": true,
 "max_physical_memory": 2048,
 "cpu_cap": 100,
 "alias": "1.dalmatinerdb",
 "quota": "80",
 "zfs_root_compression": "on",
 "resolvers": [
  "8.8.8.8",
  "8.8.4.4"
 ],
 "nics": [
  {
   "interface": "net0",
   "nic_tag": "admin",
   "ip": "10.1.1.24",
   "gateway": "10.1.1.1",
   "netmask": "255.255.255.0"
  }
 ]
}
Next we create our DalmatinerDB JSON payload files and create our zone.
cd /opt
vi 1.dalmatinerdb.json
vmadm create -f 1.dalmatinerdb.json
The rest of the setup will be done within our newly created DalmatinerDB zone.
(Step 2) Zone Configuration
We now zlogin into the DalmatinerDB Zone
zlogin <zone-uuid>
First we do need to configure the delegate dataset to be mounted to /data we can do this from within the zone with the following command:
zfs set mountpoint=/data zones/$(zonename)/data
Add the FiFo package repository then install the "dalmatinerfe", "dalmatinerdb", "nsq" and "tachyon" services.
VERSION=rel
echo "http://release.project-fifo.net/pkg/${VERSION}" >> /opt/local/etc/pkgin/repositories.conf

curl -O https://project-fifo.net/fifo.gpg
gpg --primary-keyring /opt/local/etc/gnupg/pkgsrc.gpg --import < fifo.gpg
gpg --keyring /opt/local/etc/gnupg/pkgsrc.gpg --fingerprint

pkgin -fy up
pkgin in dalmatinerfe dalmatinerdb nsq tachyon
Next we configure all the services in the Zone and edit each respective configuration file and changing ONLY the following settings - the rest of the config options will remain unchanged:
svcadm enable epmd
svcadm enable nsqadmin
svcadm enable nsqlookupd
svcadm enable nsqd
svcs epmd nsqadmin nsqlookupd nsqd

vi /data/dalmatinerdb/etc/dalmatinerdb.conf
vi /data/dalmatinerfe/etc/dalmatinerfe.conf
dalmatinerdb.conf
vi /data/dalmatinerdb/etc/dalmatinerdb.conf
nodename = dalmatinerdb@10.1.1.24
handoff.ip = 10.1.1.24
lifetime = infinity
Note: You may want to adjust the lifetime = infinity value to something that matches your storage and data retention policies. As it stands, the infinity value will continue to store data until you run out of disk space.
dalmatinerfe.conf
vi /data/dalmatinerfe/etc/dalmatinerfe.conf
backend_server = 10.1.1.24:5555
nodename = dalmatinerfe@10.1.1.24
Next we start the services and confirm they are running:
svcadm enable epmd
svcadm enable dalmatiner/db
svcadm enable dalmatiner/fe
svcs epmd dalmatiner/db dalmatiner/fe
Next run the ddb-admin buckets command to confirm that the bucket is showing and check the time to live via ddb-admin ttl dalmatinerdb which by default is set to infinity.
$ ddb-admin buckets
dalmatinerdb

$ ddb-admin ttl dalmatinerdb
infinity
You should now be able to access the DDB Web Frontend and see your bucket. Point your web browser at http://10.1.1.24:8080/

Now we configure and start the Tachyon Aggregator service:
tachyon.conf
vi /data/tachyon/etc/tachyon.conf
ddb = 10.1.1.24:5555
svcadm enable epmd
svcadm enable tachyon
svcs tachyon
(Step 3) Setup Tachyon-meter in the Global Zone
Return to the global zone of your hypervisor/s and download and install the tachyon-meter service. This is a service that gathers and distributes KSTAT metrics to NSQ which send it to the Tachyon Aggregator which optimizes it before sending it to DalmatinerDB.
cd /opt
curl -O http://release.project-fifo.net/gz/rel/tachyon-meter-latest.gz
gunzip tachyon-meter-latest.gz
sh tachyon-meter-latest
Now we configure and start the Tachyon Meter service:
tachyon.conf
vi /opt/tachyon-meter/etc/tachyon.conf
host=10.1.1.24
svcadm enable tachyon-meter
svcs tachyon-meter
(Step 4) Configure FiFo Zone for Metrics & DalmatinerDB
Final step is to zlogin to your FiFo Zone and edit the following file and change the DDB ip and port to the ip of the zone running DalmatinerDB.
vi /data/sniffle/etc/sniffle.conf
vi /data/snarl/etc/snarl.conf
vi /data/howl/etc/howl.conf
sniffle.conf
folsom_ddb.ip = 10.1.1.24:5555
snarl.conf
folsom_ddb.ip = 10.1.1.24:5555
howl.conf
folsom_ddb.ip = 10.1.1.24:5555
backend_server = 10.1.1.24:5555
Restart your services and login to Cerberus UI and you should now see working metric graphs shown for both vm's and hypervisors.
svcadm restart sniffle
svcadm restart snarl
svcadm restart howl
svcs sniffle snarl howl
(Step 5) optional - Grafana setup
Since Grafana does not ship with support for a native DalmatinerDB datasource we maintain a special fork that includes support.
At present, a precompiled binary of Grafana with our changes can be downloaded here.
For the purposes of this guide we will run Grafana in the same zone as DalmatinerDB. Zlogin to the DalmatinerDB zone and install and run the binary.
curl -O http://release.project-fifo.net/chunter/rel/grafana-2.0.2.tgz
tar -xvzf grafana-2.0.2.tgz
cd grafana
./grafana
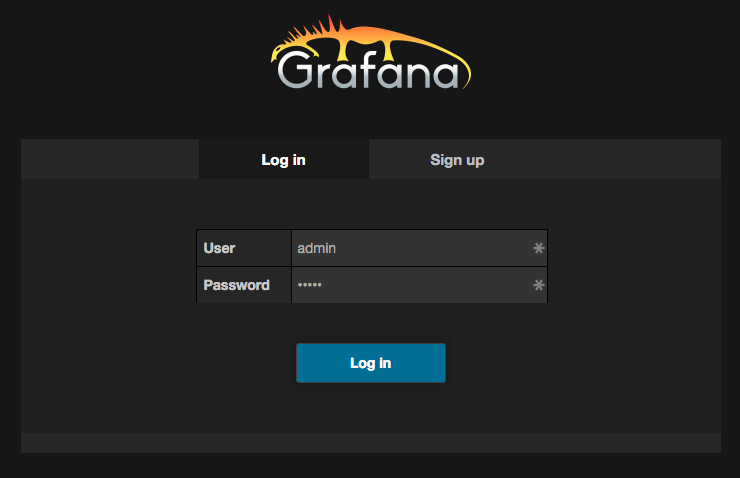
You can now login to the Grafana Web Interface on http://10.1.1.24:3000 the default username and password is admin / admin

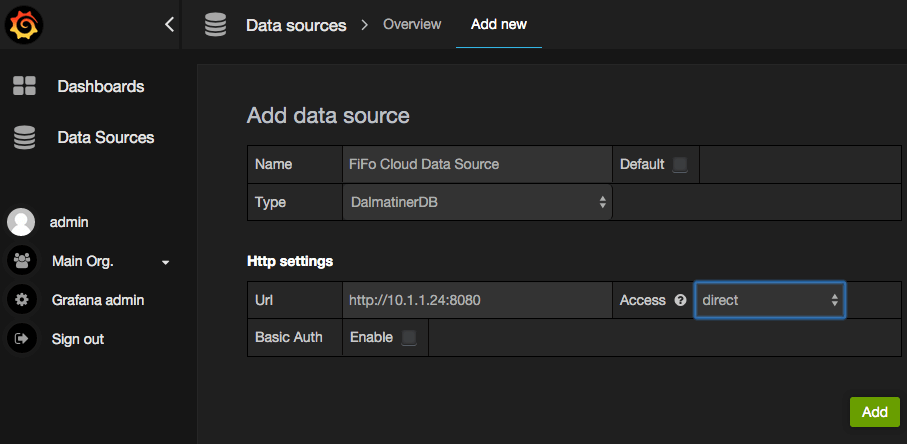
Add and configure your data source then start creating custom graphs. Have fun!


Updated less than a minute ago
